Original Research
Jan 2022
Peer-Reviewed

Background: Access to dental care in mixed-race and predominantly African American wards in the District of Columbia (DC) was investigated in relation to community development.
Methods: This study used high-resolution geographic information system (GIS) tools to map all general dentistry and periodontal practice locations in DC wards. The spatial analysis contextualized each ward’s land use and demographic data obtained from DC government reports.
Findings: The analysis revealed inter-ward inequity in dental care access, which was measured by proximity to and number of dental clinics in each DC ward. Residents in affluent wards had access to many dental practices and superior amenities. Residents in wards poorly served by public transportation and with few resources had few, if any, dental clinics.
Conclusions: Dental practices are inequitably distributed across DC wards. DC policy should prioritize community development—specifically, resource allocation and community outreach—to promote health equity and improve access to and quality of dental care among residents of color.
The 2000 Surgeon General report on oral health underscored that “there are profound and consequential disparities in oral health” that primarily affect persons who are poor and have racially and ethnically minoritized identities.1 Sources of inequity include social determinants (eg, lack of financial resources, transportation, understanding of oral health’s roles in overall health). Persons with low incomes have compromised access to insurance coverage for dental services, and Medicaid offers limited dental coverage.1,2 Dental care access inequity differs between and within states, exacerbated by shortages of dental professionals in identified areas.3,4
Regional distributions of dental services have been evaluated using models based on a geographic information system (GIS) to determine the number of new dental practices needed to allow accessibility to a dentist within a certain number of miles.5 GIS has not, however, been used to study relationships between oral health care access and community development. Accordingly, this research contextualized each DC ward’s land use and demographic data, obtained from District of Colombia (DC) government reports, with spatial analysis enabled by GIS mapping of dental practice locations.
DC covers 68.34 miles of land6 and includes numerous historically African American communities. As defined by the DC Office of Planning, a ward is a district “established for administrative or political purposes” and represented by an elected council member.7 For each DC ward, we collected and summarized dental practice, land use, income, and employment status data. General dentistry and periodontal practice locations were collected online, entered into a database, and coded by specialty, street address, and zip code. Other data were obtained from DC government and census reports. We used the Quantum Geographic Information System to overlay the DC general and periodontal dental practice locations on a map of census tracts integrating population data to create a dental practice map and then overlaid ward boundaries on the map.
Residents of DC’s Ward 4 have the most access to dental care, and residents of Ward 8 have the least. Residents of Wards 1, 5, and 7 also have compromised access to dental services. (See Figure.)
Figure. Ward Map of Locations of DC General Dentistry and Periodontal Practices With Census Tract Population Dataa
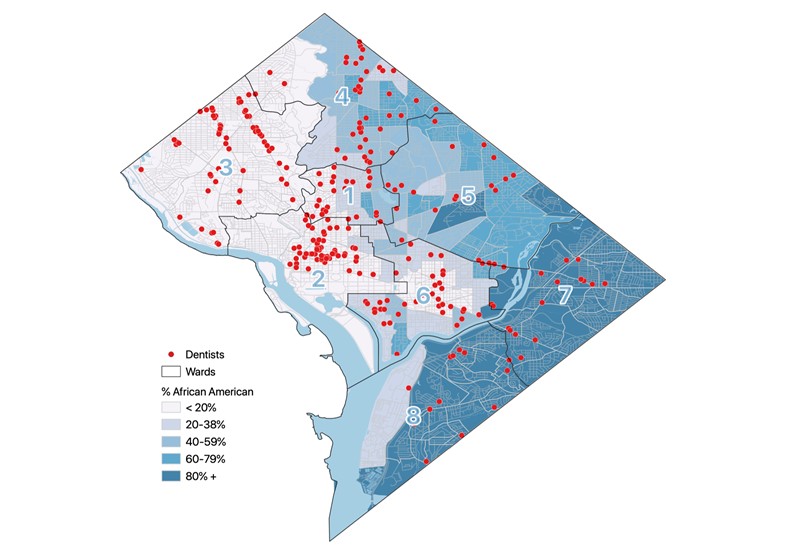
a Census tract-level demographic data from the 2018 American Community Survey were joined with US Census Bureau Tiger/Line shapefiles. Dental practice locations were obtained from a web-based dental directory database.8
Ward 4 is affluent, with a 2021 median income of $94 163 compared to the DC citywide median income of $91 414.9 It has low crime rates, abundant community organizations, neighborhood amenities (eg, retail), well-integrated Metrorail service, relatively high-performing public schools with strong parental support, and substantial unmet need for new affordable housing units.10 In 2021, about 31% of Ward 4 residents identified as White, a percentage slightly below the DC citywide average of 42%.9 When the wards were overlaid on the map of dental practice locations, it is apparent that there are numerous dental practices distributed throughout the ward. Taken together, the demographic data and map of dental practice locations suggest a relation between Ward 4’s community development and its residents’ access to oral health services.
Ward 8 communities are inhabited by residents with lower incomes and are less publicly resourced and economically developed. Although Ward 8 has been racially integrated since 1877,11 it is now about 92% African American.12 In 2021, the median household income in Ward 8 of $39 473 was the lowest in DC and less than half DC’s median income.12 An influx of new residents to Ward 8 in the 1950s created economic and social disruption that continued into the 1990s. In 2000, 1 in 6 housing units in Ward 8 were vacant and 1 in 3 residents of Ward 8 lived in poverty.11 The unemployment rate of 18% in Ward 8 is about 2.5 times higher than the average of 7.3% for the DC area.12 When Ward 8 was overlaid on the map of dental practice locations, it’s clear that there is a lack of dental practices.
Data on median income and population density for all the wards are displayed in the Table.
| Ward | Median Income | Square Miles | Population |
|---|---|---|---|
| Ward 1 | $110 33913 | 2.514 | 91 67313 |
| Ward 2 | $112 24415 | 6.416 | 92 80915 |
| Ward 3 | $143 33917 | 10.418 | 84 97919 |
| Ward 4 | $94 1639 | 8.920 | 87 1509 |
| Ward 5 | $91 18921 | 10.222 | 90 38021 |
| Ward 6 | $113 92223 | 5.724 | 103 19723 |
| Ward 7 | $42 20125 | 8.426 | 80 66925 |
| Ward 8 | $39 47312 | 8.727 | 80 51712 |
Residents of DC wards with high percentages of persons with minoritized racial and ethnic identities and low median incomes have more limited access to oral health services than residents of more affluent DC wards. They have less access to well-integrated public transportation and must travel farther to access dental care in DC than residents of wards that have more community development and investment. These findings align with data from similar studies of other regions of the United States. For example, a GIS study in Ohio also revealed lack of access to dental care among residents in historically rural and low-income areas.5
Inequitable distribution of dental practices across DC reveals inequity in dental care access. Some residents endure more obstacles to accessing dental services than others. Identifying neighborhoods with limited access should be a public policy priority to encourage reform and innovation (eg, student loan repayment options and other incentives for oral health clinicians to practice in culturally and economically diverse communities) and would help develop public health outreach programs that promote equitable access to quality oral health services.
US Department of Health and Human Services. Oral Health in America: A Report of the Surgeon General. National Institute of Dental and Craniofacial Research, National Institutes of Health; 2000. Accessed October 5, 2021. https://www.nidcr.nih.gov/sites/default/files/2017-10/hck1ocv.%40www.surgeon.fullrpt.pdf
Patrick DL, Lee RS, Nucci M, Grembowski D, Jolles CZ, Milgrom P. Reducing oral health disparities: a focus on social and cultural determinants. BMC Oral Health. 2006;6(suppl 1):S4.
Health professional shortage areas: dental care, by county, 2021. Rural Health Information Hub. Accessed October 4, 2021. https://www.ruralhealthinfo.org/charts/9
Dental care health professional shortage areas (HPSAs). Kaiser Family Foundation. September 30, 2020. Accessed August 5, 2021. https://www.kff.org/other/state-indicator/dental-care-health-professional-shortage-areas-hpsas/?currentTimeframe=0&sortModel=%7B%22colId%22:%22Location%22,%22sort%22:%22asc%22%7D
Washington DC map. Whereig. Accessed October 4, 2021. https://www.whereig.com/usa/states/washington-dc-map.html
Tregoning H, Hughey R, Phillips J, Azimeraw M, Sheres D, Thomas C. Indices: a statistical index of District of Columbia services. Office of Planning, District of Columbia; 2013. Accessed August 7, 2021. https://planning.dc.gov/sites/default/files/dc/sites/op/page_content/attachments/Chapter%201.pdf
DentistListPro. Accessed July 2021. https://www.dentistlistpro.com/
2021 Demographics: summary of data for ward: ward 4. DC Health Matters. Updated January 2021. https://www.dchealthmatters.org/demographicdata?id=131491
Office of City Planning, District of Columbia. Upper northeast area element. In: Comprehensive Plan. Office of City Planning, District of Columbia; 2011:chap 24. Accessed August 7, 2021. https://planning.dc.gov/sites/default/files/dc/sites/op/publication/attachments/District%20Elements_Volume%20II_Chapter%2024_April%208%202011.pdf
Office of Planning, District of Columbia. Far southeast/southwest area element. In: Comprehensive Plan. Office of Planning, District of Columbia; 2011:chap 18. Accessed October 4, 2021. https://planning.dc.gov/sites/default/files/dc/sites/op/publication/attachments/Chapter%252018%2520Comp%2520Plan%2520Updates%2520Opti.pdf
Summary data for ward: ward 8. DC Health Matters. Updated January 2021. Accessed August 24, 2021. https://www.dchealthmatters.org/demographicdata?id=131495
Summary data for ward: ward 1. DC Health Matters. Updated January 2021. Accessed August 24, 2021. https://www.dchealthmatters.org/demographicdata?id=131488
Ward 1, DC. Census Reporter. Accessed August 24, 2021. https://censusreporter.org/profiles/61000US11001-ward-1-dc/
Summary data for ward: ward 2. DC Health Matters. Updated January 2021. Accessed August 24, 2021. https://www.dchealthmatters.org/demographicdata?id=131489
Ward 2, DC. Census Reporter. Accessed August 24, 2021. https://censusreporter.org/profiles/61000US11002-ward-2-dc/
Population data for ward: ward 3. DC Health Matters. Updated January 2021. Accessed August 24, 2021. https://www.dchealthmatters.org/demographicdata?id=131490§ionId=935/
Ward 3, DC. Census Reporter. Accessed August 24, 2021. https://censusreporter.org/profiles/61000US11003-ward-3-dc/
Households/income data for ward: ward 3. DC Health Matters. Updated January 2021. Accessed August 24, 2021. https://www.dchealthmatters.org/demographicdata?id=131490§ionId=936
Ward 4, DC. Census Reporter. Accessed August 24, 2021. https://censusreporter.org/profiles/61000US11004-ward-4-dc/
Summary data for ward: ward 5. DC Health Matters. Updated January 2021. Accessed August 24, 2021. https://www.dchealthmatters.org/demographicdata?id=131492
Ward 5, DC. Census Reporter. Accessed August 24, 2021. https://censusreporter.org/profiles/61000US11005-ward-5-dc/
Summary data for ward: ward 6. DC Health Matters. Updated January 2021. Accessed August 24, 2021. https://www.dchealthmatters.org/demographicdata?id=131493
Ward 6, DC. Census Reporter. Accessed August 24, 2021. https://censusreporter.org/profiles/61000US11006-ward-6-dc
Summary data for ward: ward 7. DC Health Matters. Updated January 2021. Accessed August 24, 2021. https://www.dchealthmatters.org/demographicdata?id=131494
Ward 7, DC. Census Reporter. Accessed August 24, 2021. https://censusreporter.org/profiles/61000US11007-ward-7-dc/
Ward 8, DC. Census Reporter. Accessed August 24, 2021. https://censusreporter.org/profiles/61000US11008-ward-8-dc/